Data transmission and performance visualization.
Securely connect IoT gateways with Enerinno or third-party platforms using MQTT and HTTP APIs.
Enerinno Dashboard in Action
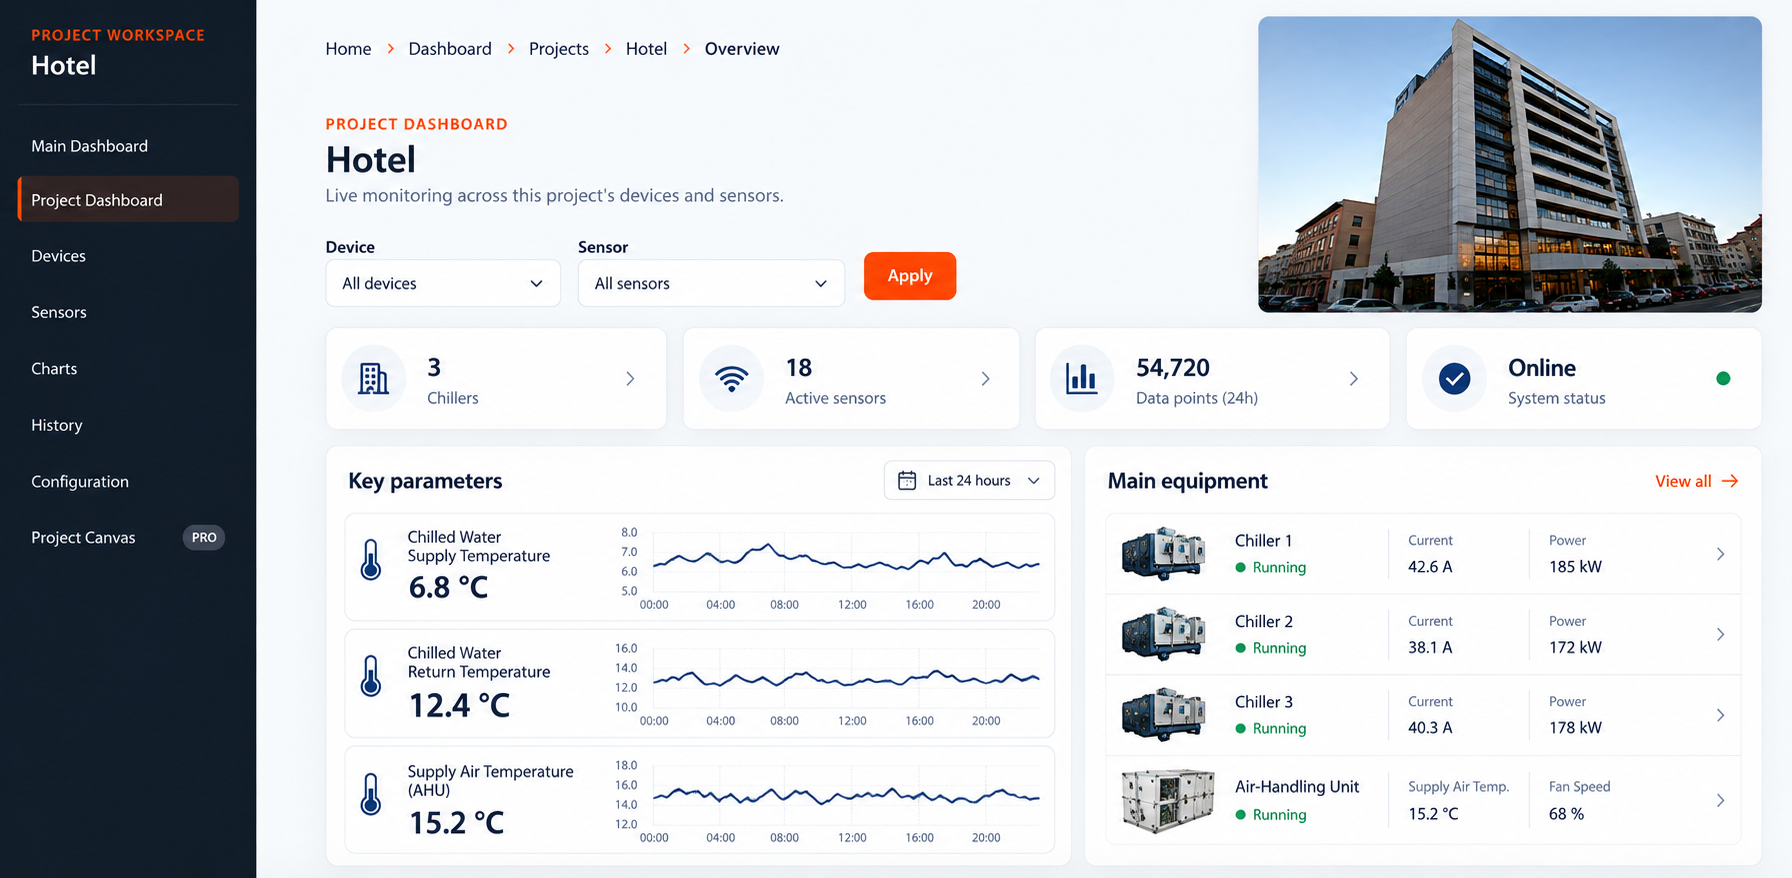
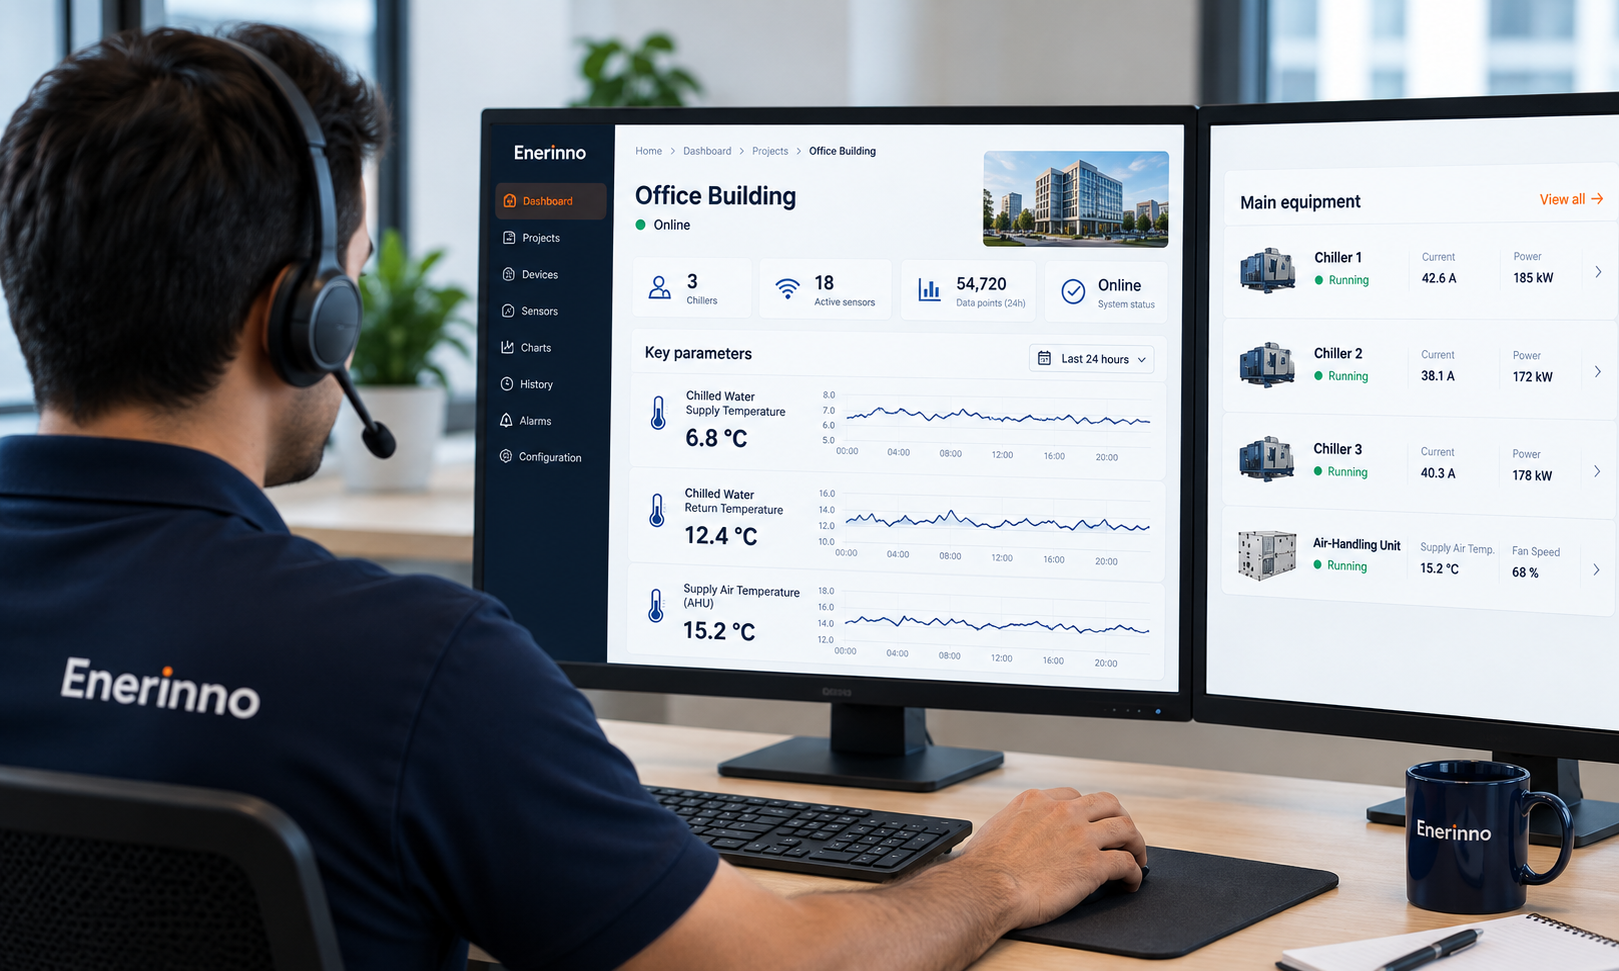
Explore how Enerinno supports monitoring, analysis and system troubleshooting. Screenshots of the six dashboard features will be added below.
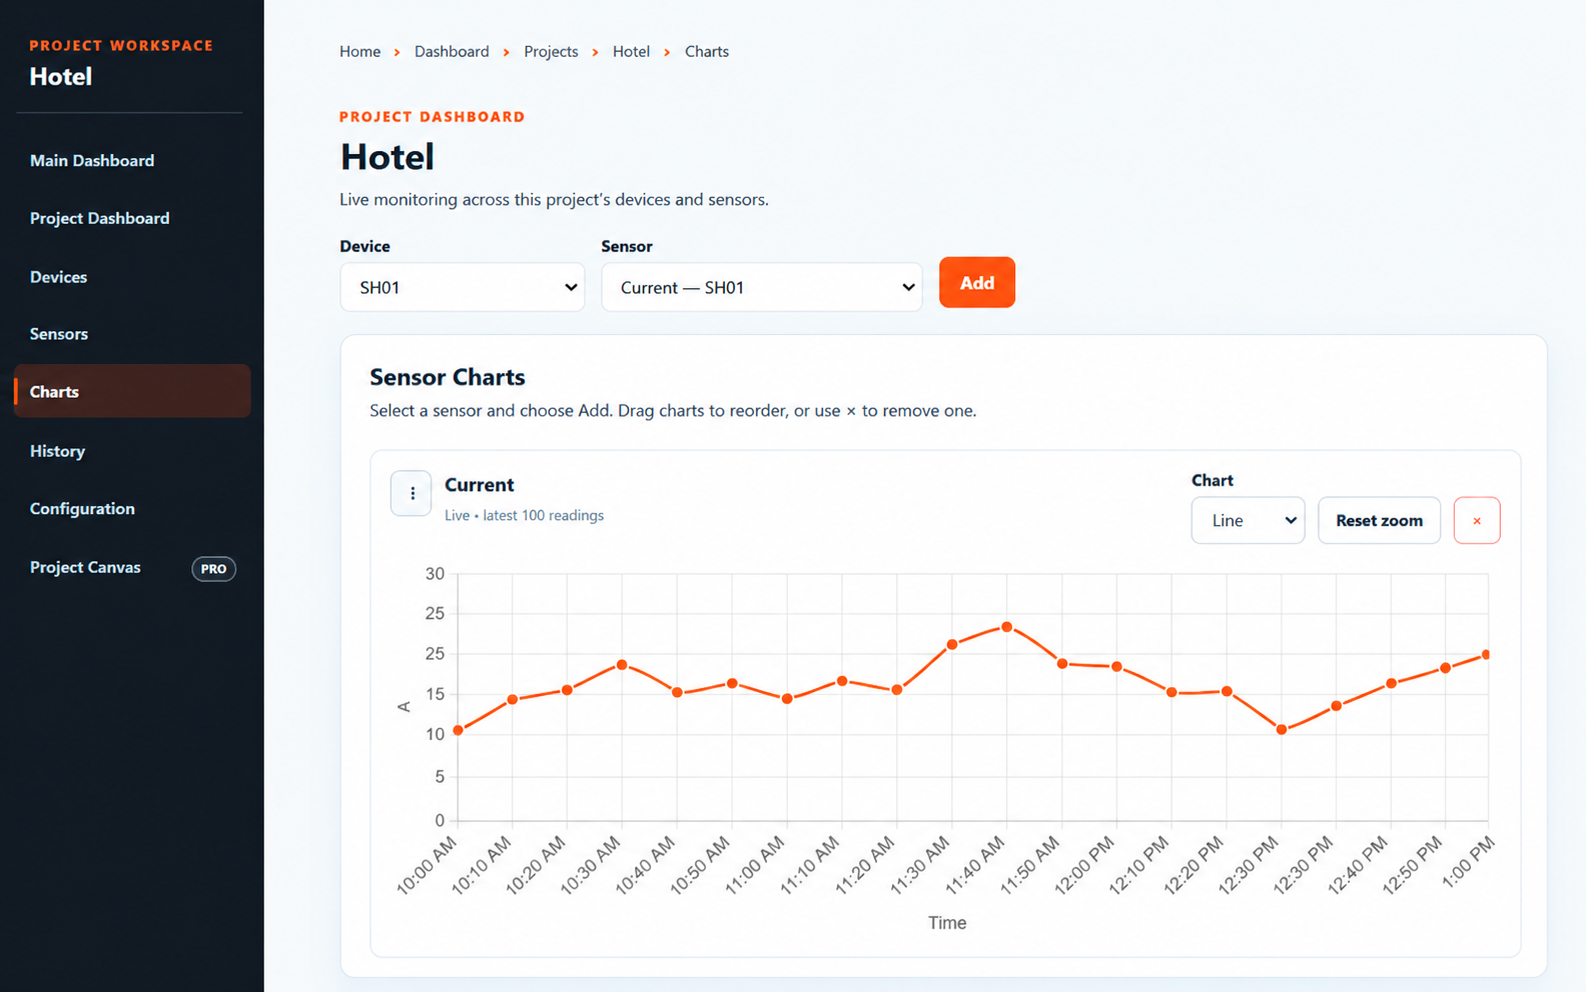
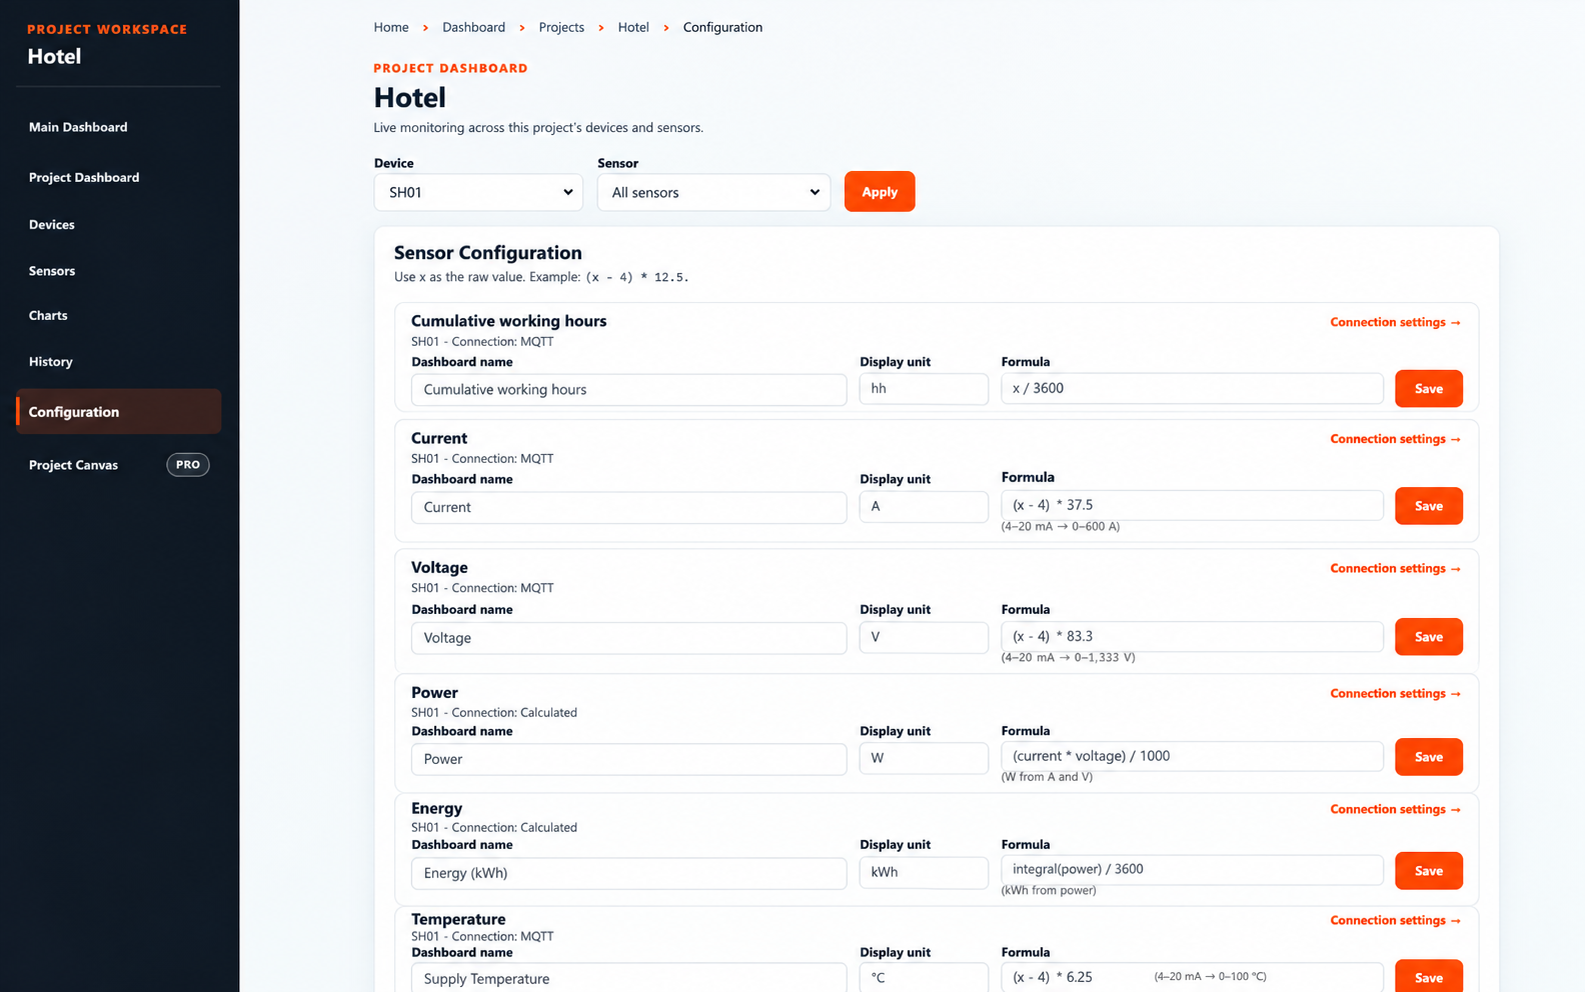
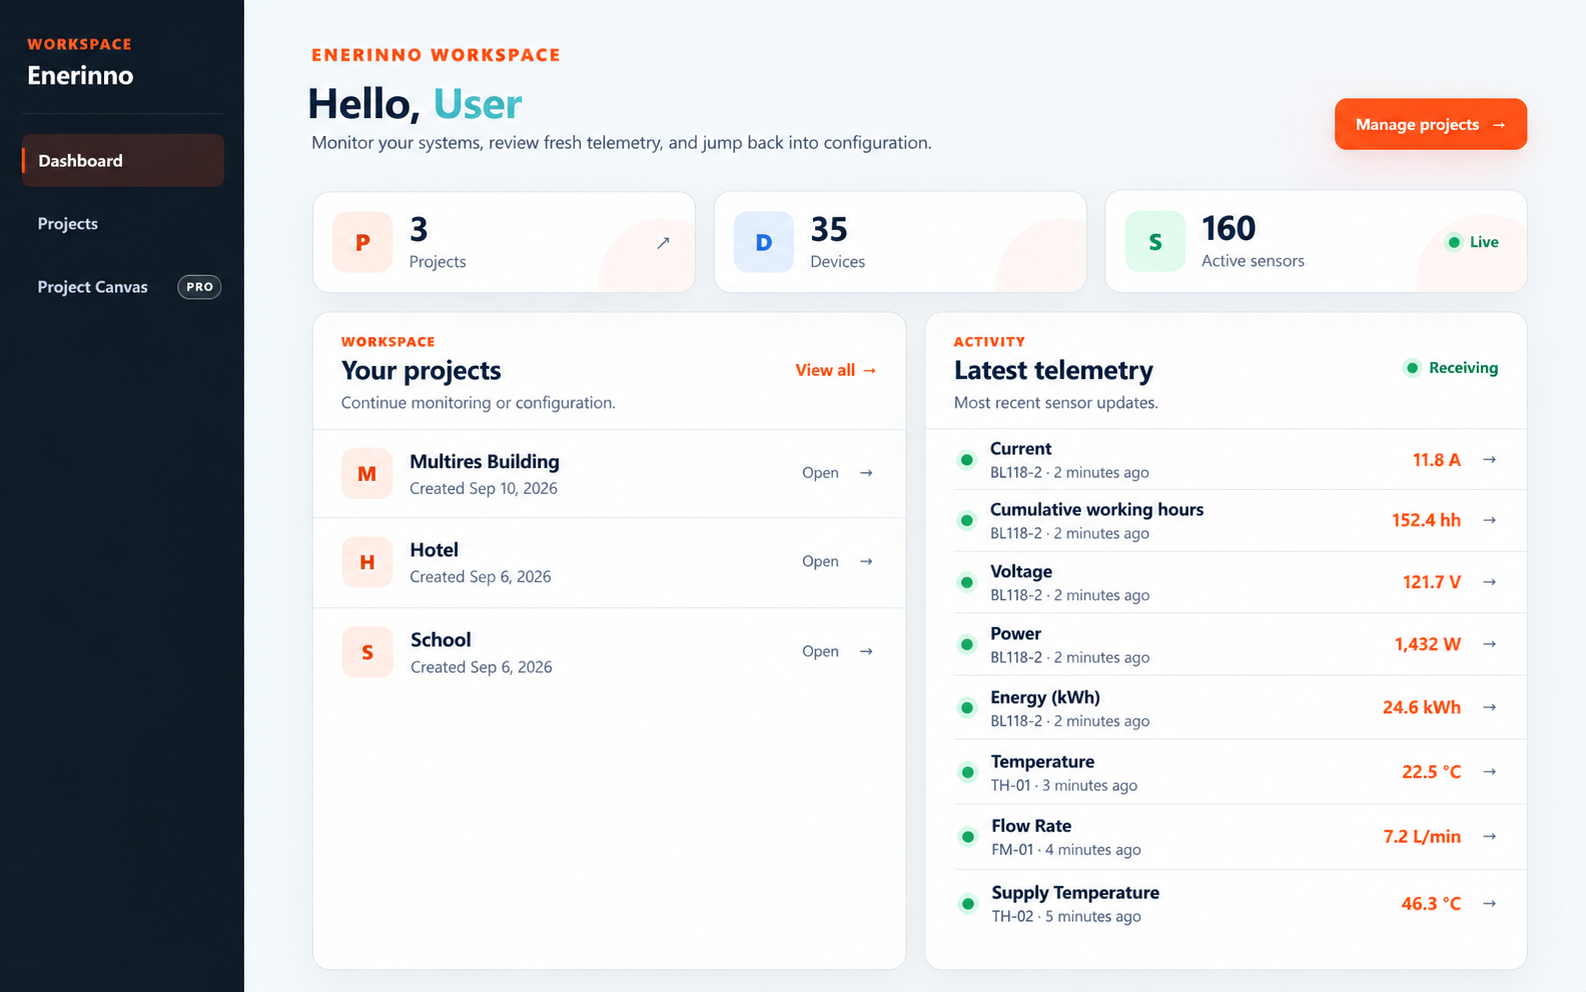
Flexible communication
MQTT
Lightweight publish/subscribe messaging supports scalable distribution of device data through broker topics, configurable QoS and authenticated connections.
HTTP API
Integrate customized data payloads with external cloud applications and customer dashboards.
Security
Use TLS, authentication and access control as appropriate to the gateway and receiving platform.
Project Canvas Makes System Behavior
Visible Before Analysis
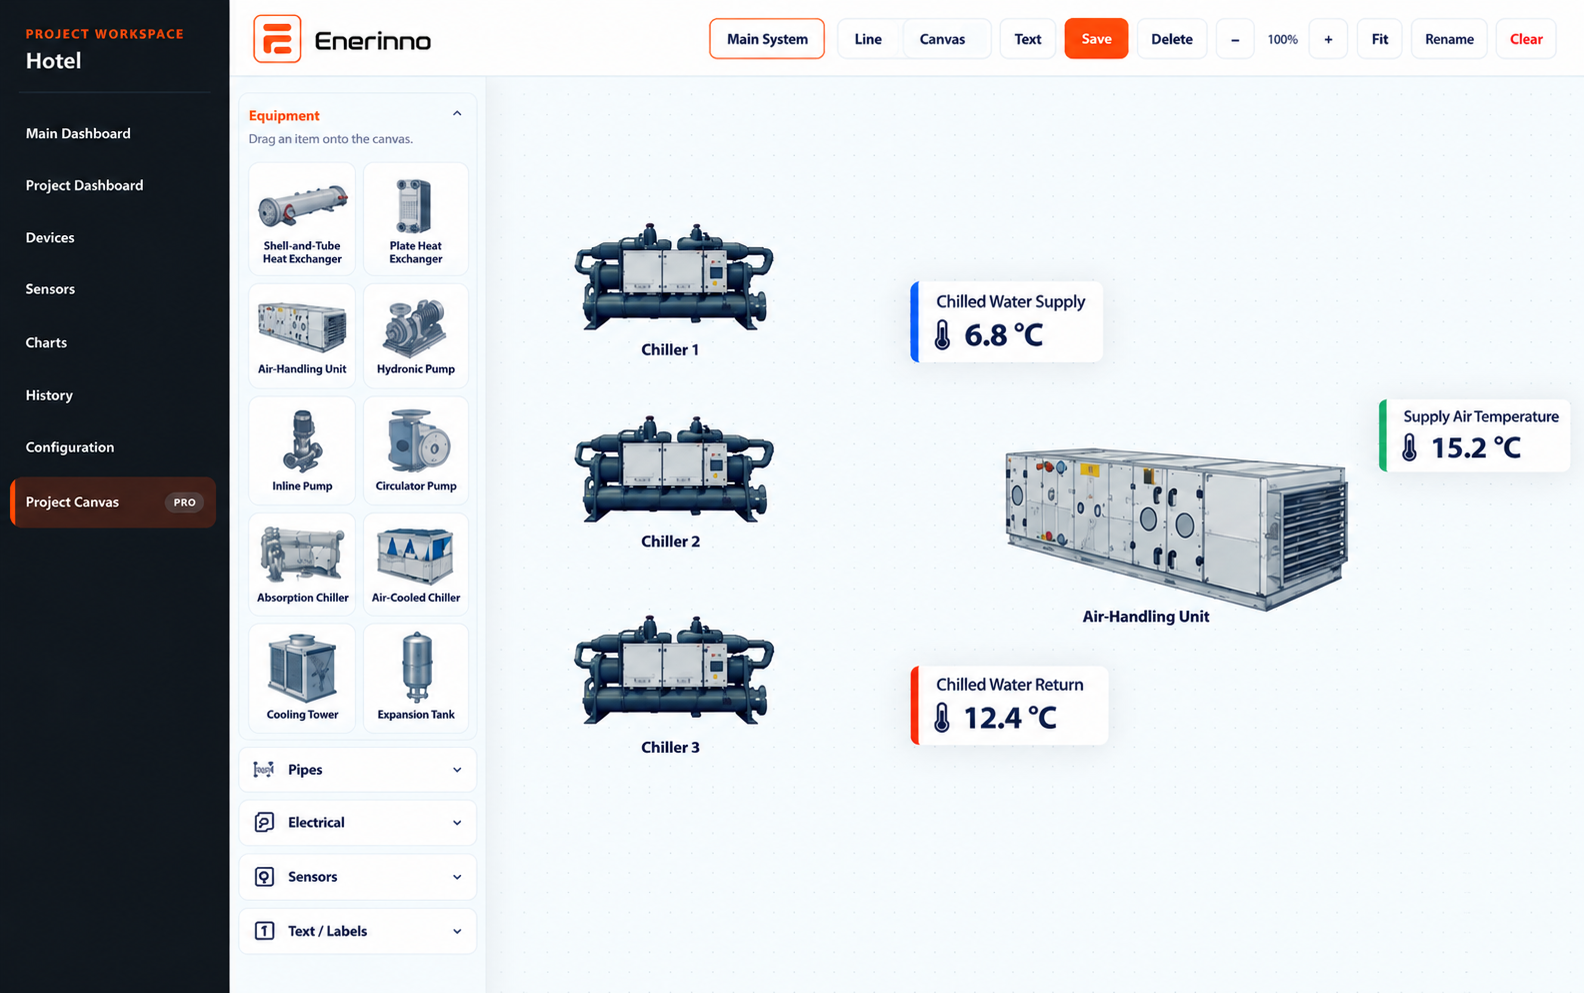
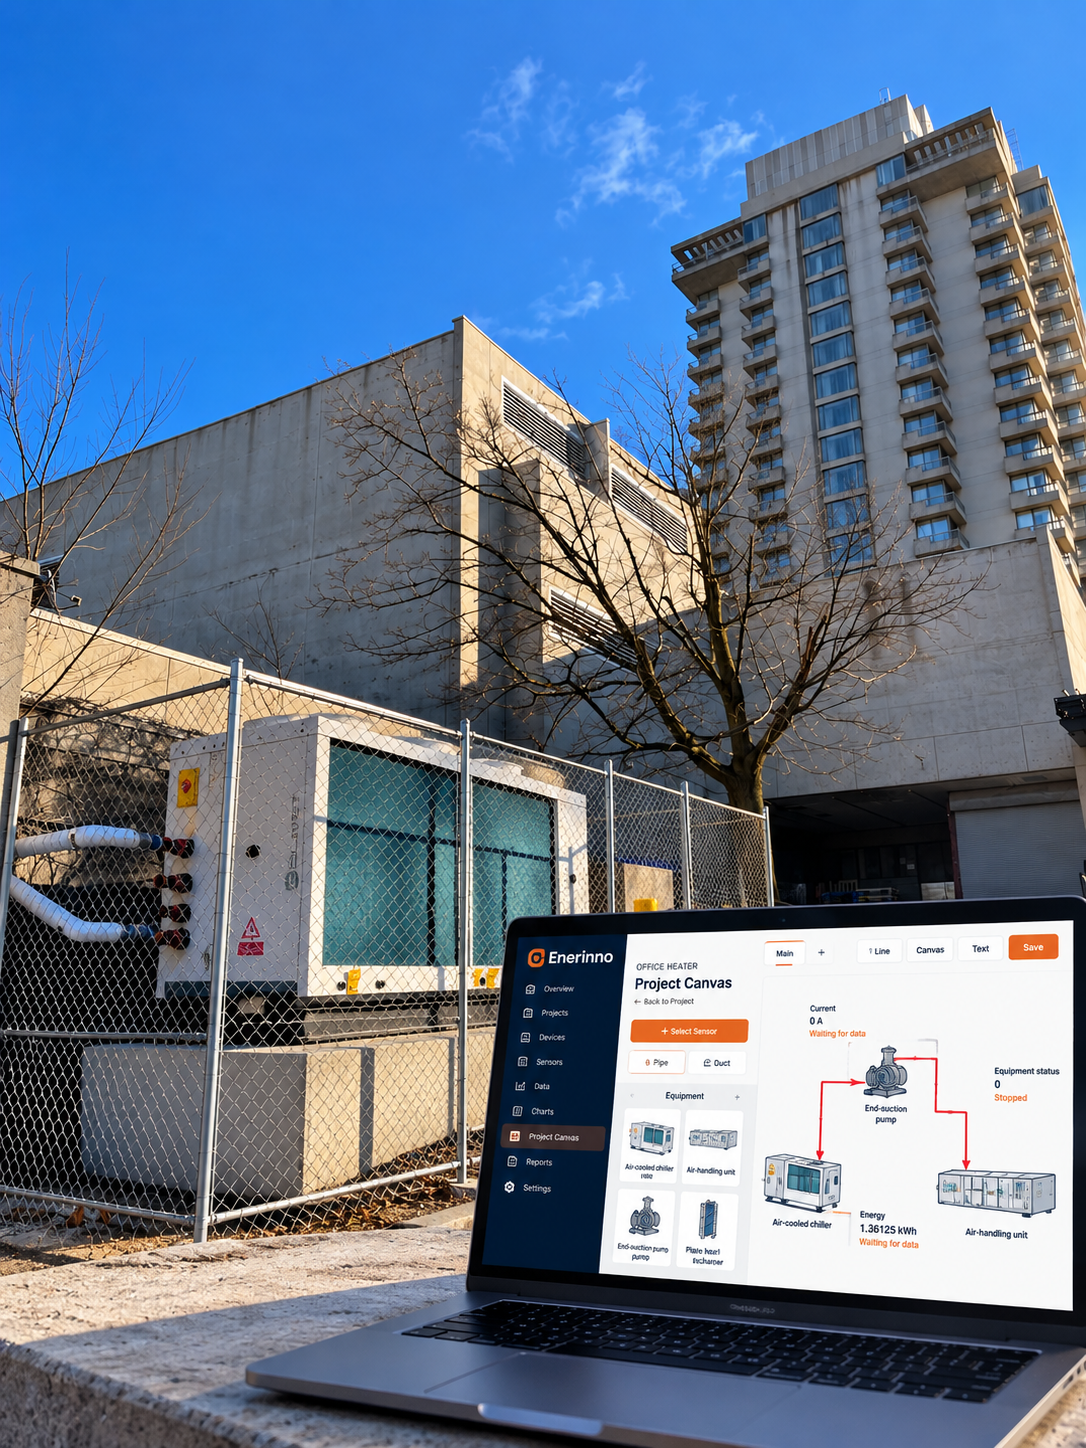
Visualize equipment connections, live sensor readings and operating status together in one engineering workspace.
 Air-Cooled Chiller
 Hydronic Pump
 Air-Handling Unit
Shared Troubleshooting View
Give clients, contractors and operators one visual reference during commissioning.
Operational Checks
Identify unexpected temperatures, flows, staging or control behavior.
Live System Context
See equipment connections and sensor values together.
Illustrative Project Canvas layout. Sensor values are examples, not live measurements.
ENGINEERING-LED VISUALIZATION
Why Project Canvas Matters for HVAC Systems
Unlike conventional monitoring dashboards that display sensor readings separately, Enerinno Project Canvas brings equipment, system connections, and operating data together in one visual workspace.
Visual System Understanding
 Visual System Understanding
View HVAC equipment and associated sensor readings in the context of the mechanical system.
Faster understanding of equipment relationships and operating conditions.
Faster Troubleshooting
 Faster Troubleshooting
Identify abnormal temperatures, flow conditions, and equipment behavior without navigating multiple dashboards.
Reduced diagnostic time and fewer unnecessary site visits.
System Balancing
 System Balancing
Compare supply and return conditions across connected equipment to support balancing and optimization.
More stable system operation and opportunities to reduce energy consumption.
Commissioning & Verification
 Commissioning & Verification
Review operating conditions and confirm system performance during commissioning and ongoing operation.
Faster commissioning and better documented equipment performance.
Remote Technical Support
 Remote Technical Support
Give engineers, contractors, and building operators a common visual reference for remote diagnostics.
Quicker technical assistance and improved collaboration with site operators.
Customized Engineering Views
 Customized Engineering Views
Build project-specific diagrams incorporating chillers, heat pumps, pumps, AHUs, and other equipment.
Simplified system monitoring with project-specific performance indicators.
Monitoring and verifying HVAC system performance to assess fuel-switching opportunities and energy efficiency.
See Project Canvas in Action
Discover how Enerinno brings equipment layouts, sensor readings and system monitoring together in one engineering workspace. Request a demonstration with our team.